1.1 Introduction
In previous classes we have more explored of the world of real numbers and encountered irrational numbers.
Here we'll continue more learn about the real numbers.
1.2 Euclid's Division Lemma
2.1 Introduction
We have learnt that a polynomials in one variable and their degrees. Recall that if p(x) is a polynomial in x, the highest power of x in p(x) is called the degree of the polynomial p(x). For example, 4x + 2 is a polynomial in the variable x of degree 1, 2y2 − 3y + 4 is a polynomial in the variable y of degree 2. Continue Learning
3.1 Introduction
Linear equations in two variables are equations which can be expressed as ax + by + c = 0, where a, b and c are real numbers and both a, and b are not zero. The solution of such equations is a pair of values for x and y which makes both sides of the equation equal.
3.2 Pair of Linear Equations in Two Variables
4.1 Introduction
We have learnt different types of polynomials. One type was the quadratic polynomial of the form ax2 + bx + c, a ≠ 0. When we equate this polynomial to zero, we get a quadratic equation. Quadratic equations come up when we deal with many real-life situations. Continue Learning
5.1 Introduction
An arithmetic progression or arithmetic sequence is a sequence of numbers such that the difference between the consecutive terms is constant.
We will learn ourselves of arithmetic progressions and also learn about how to constructing an arithmetic progression (A.P). Continue Learning
6.1 Introduction
We all are familiar with triangles and many of their properties, we have learnt in previous classes.
We have learnt that two figures are said to be congruent, if they have the same shape and the same size.
To finding all the heights and distances have been found out using the idea of indirect measurements, which is based on the principle of similarity of figures. We will learn here to finding the solutions. Continue Learning
7.1 Introduction
We have learnt that to locate the position of a point in a plane of coordinate axes. The distance of a point from the y-axis is called its x-coordinate, or abscissa. The distance of a point from the x-axis is called its y-coordinate, or ordinate. The coordinates of a point on the x-axis are of the form (x, 0), and of a point on the y-axis are of the form (0, y). Continue Learning
8.1 Introduction
The word ‘trigonometry’ is derived from the Greek words ‘tri’ (meaning three), ‘gon’ (meaning sides) and ’metron’ (meaning measure). In fact, trigonometry is the study of relationships between the sides and angles of a triangle.
The earliest known work on trigonometry was recorded in Egypt and Babylon. Early astronomers used it to find out the distances of the stars and planets from the Earth. Continue Learning
9.1 Introduction
As we have studied about trigonometric ratios. Here will be studying about some ways in which trigonometry is used in the life around us.
9.2 Heights and Distances
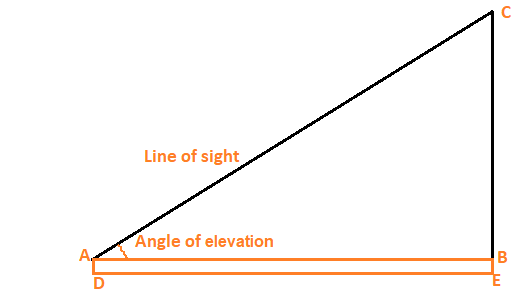
In the figure line of sight is the line drawn from the eye of an observer to the point in the object viewed by the observer. Continue Learning
10.1 Introduction
We have learnt that a circle is a collection of all points in a plane which are at a constant distance (radius) from a fixed point (centre). Also studied various terms related to a circle like chord, segment, sector, arc etc.
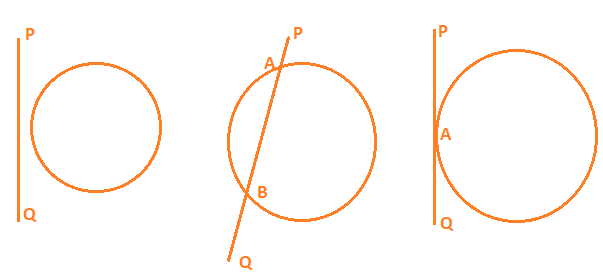
In the figure the line PQ and the circle have no common point. In this case, PQ is called a non-intersecting line with respect to the circle. Continue Learning
11.1 Introduction
We have learnt some of constructions using a straight edge (ruler) and a compass, e.g., bisecting an angle, drawing the perpendicular bisector of a line segment, some constructions of triangles etc. and also gave their justifications.
Here we will learn some more constructions by using the knowledge of the earlier constructions. Continue Learning
12.1 Introduction
We all are more familiar with some of methods to finding perimeters and areas of simple plane figures such as rectangles, squares, parallelograms, triangles and circles.
We will learn here with a review of the concepts of perimeter (circumference) and area of a circle and apply this knowledge in finding the areas of two special ‘parts’ of a circular region (or briefly of a circle) known as sector and segment. Continue Learning
13.1 Introduction
We have learnt and familiar with some of the solids like cuboids, cone, cylinder, and sphere and also learnt how to find their surface areas and volumes.
Here we will learn how to find surface areas and volumes of objects.
13.2 Surface Area of a Combination of Solids
14.1 Introduction
We have learnt that to represent the data pictorially in the form of various graphs such as bar graphs, histograms (including those of varying widths) and frequency polygons and also numerical representatives of the ungrouped data, also called measures of central tendency, namely, mean, median and mode.
We will learn the concept of cumulative frequency, the cumulative frequency distribution and how to draw cumulative frequency curves, called ogives. Continue Learning
15.1 Introduction
We had learnt about the experimental (or empirical) probabilities of events which were based on the results of actual experiments.
Probabilities are based on the results of an actual experiment. Experimental probabilities are based on the results of actual experiments and adequate recordings of the happening of the events. Moreover, these probabilities are only ‘estimates’. Continue Learning