
Graphs are visual representations of data collected. Data can also be presented in the form of a table; however a graphical presentation is easier to understand.
We learnt something about the graphs in previous class where we see the bar graphs, Pictographs etc. we learn here more about these.
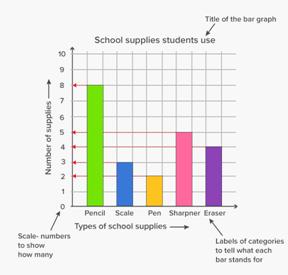
A bar graph is used to show comparison among categories. It may consist of two or more parallel vertical (or horizontal) bars (rectangles).
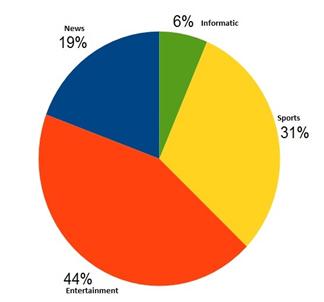
A Pie graph (or a circle-graph)
A pie-graph is used to compare parts of a whole. The circle represents the whole.
It shows the percentage of viewers watching different types of TV channels.

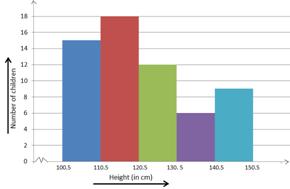
A histogram
A Histogram is a bar graph that shows data in intervals. It has adjacent bars over the intervals.
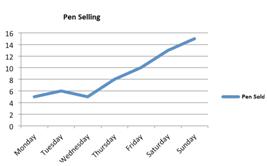
A line graph
A line graph displays data that changes continuously over periods of time.
Linear Graphs
A line graph consists of bits of line segments joined consecutively. Sometimes the graph may be a whole unbroken line.
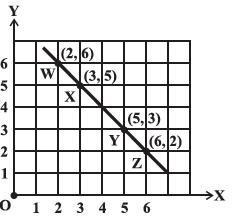
Note that in each of the above cases, graph obtained by joining the plotted points is a line. Such graphs are called linear graphs.
Similarly we can find more data and make different types of graphs or graphical representation.