Data means a collection of numbers gathered to give some information that can help us to learn something more about that. Your daily attendance, exam-marks, game scores etc are the collection of same type of data that share some information.
Collection or counting of similar type of things are said to be recording some information, that can be count, arrange and share more about that thing. For example−Collection of pen or pencil you have and the information about them like how many similar colors in that, how many pen or pencil do you have etc.
So, these all thing are said to be Recording of data.
When Collected things are arranging with the similar type of things or number is said organization of data. That is similar color of pen, similar numbers positive or negatives, similar type of fruits, vegetables, countable-uncountable etc.
Five marks should be used as a cross, as shown by‘ ’. These are called tally marks.
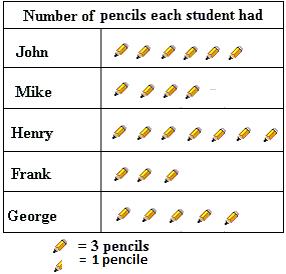
Representing of count in picture or with image/figure is called pictograph. A pictograph represents data through pictures of objects. It helps answer the questions on the data at a glance.
Interpretation of pictograph is such a kind of counting. In this we can assume some certain number with certain count.
In this image we assume one pencil is equal to 3 pencils.
Same situation by making an assumption that−Some image represents 3 pencils, some of image represents 1 pencil and then start the task of representation.
Representing of data into uniform width, curve, by line or something more in vertically and horizontally is known as graph.
When some data is representing in to uniform width and height in vertically and horizontally with equal spacing between them known as bar graph or bar diagram.